Azure FinOps Multitool: A Fast Track to Cost Optimization
In this article
Azure FinOps Multitool: A Fast Track to Cost Optimization
I built this tool out of a recurring pattern I kept seeing while working with customers across industries; organizations knew they had Azure cost challenges but had no quick way to get a clear picture of where they stood. Every engagement started with the same manual effort: piecing together cost data, chasing down tagging gaps, and trying to size optimization opportunities across subscriptions. The Azure FinOps Multitool is my answer to that problem, built to solve the "cold start", helping teams quickly understand their current FinOps posture and identify immediate optimization opportunities without the usual setup overhead.
What is the Azure FinOps Multitool?
The Azure FinOps Multitool scans your Azure estate and gives you a clear view of your costs, tagging health, optimization opportunities, and FinOps maturity, all organized around the three core FinOps pillars: Understand, Quantify, and Optimize.
It started as a single Windows desktop app. Since then it has grown into a family of four tools that share the same scan engine, so you can run the exact same analysis whichever way fits your workflow:
- A Windows GUI for hands-on, interactive reviews
- A terminal UI (TUI) that runs anywhere PowerShell 7 does, including macOS and Linux
- An MCP server that lets AI agents run the scans and act on what they find
- An automated function for scheduled, unattended scans
Whichever one you pick, there's no platform to stand up first. You point it at a tenant, it scans, and you get answers in minutes. It's built to beat the cold start, that first-day problem of not knowing where you actually stand.
Four Ways to Run It
The four form factors aren't four different tools doing four different things. They're four front doors to the same scan engine. Here's how I think about choosing one.
Windows GUI
The original. A WPF desktop app with a single-pane-of-glass layout, click-to-deploy buttons for tags, policies, and budgets, and one-click export to HTML, CSV, or a ready-to-open Power BI template. This is the one I reach for during a customer review or when I want to fix something on the spot. If you want to see everything at once and click your way through remediation, run the GUI.
Terminal UI (TUI)
Same scans, no GUI. It runs in any terminal on Windows, macOS, or Linux, which means it works in Cloud Shell, over SSH, or anywhere you can't (or don't want to) launch a desktop app. If you live in a terminal, or you're scanning from a Mac or a build agent, the TUI gets you the same picture without the Windows dependency.
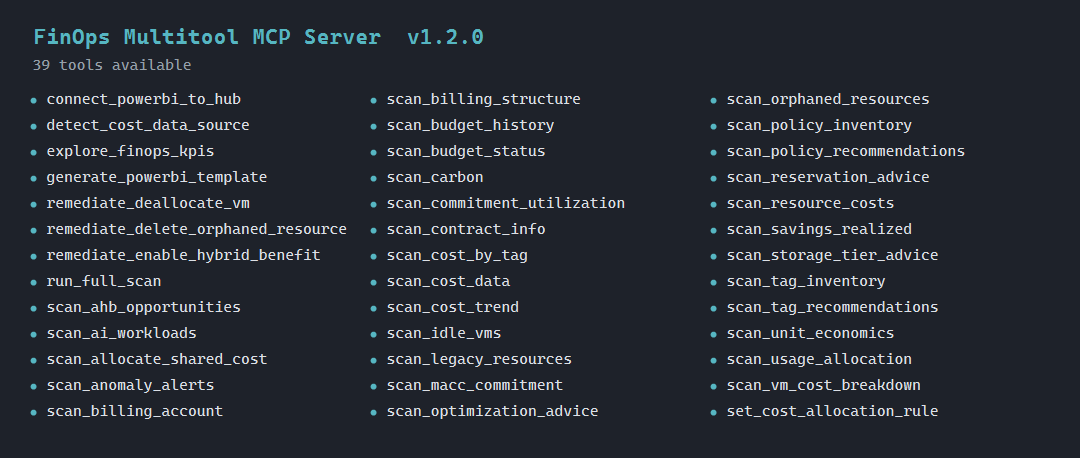
MCP Server
This is the one that changes how you interact with the data. The MCP server exposes every scan as an AI-callable tool over the Model Context Protocol, so Copilot, Claude, or a custom agent can run them and reason over the results. It also ships remediation tools (deallocate an idle VM, enable Hybrid Benefit, delete an orphaned resource) that sit behind a write-safety gate. If you want to ask "where am I wasting money" in plain language and have an agent answer it, or wire FinOps checks into an agentic workflow, this is the one.
One thing I added recently that I'm pretty happy with: FinOps KPI insights. Most people don't know the FinOps Foundation KPI catalog by name, so the server surfaces it for them. Every scan automatically tags its results with the industry KPIs they map to, like Cost per GB Stored, Commitment Utilization Score, or Percentage of Untagged Costs, and computes the value when the data supports it. There's also an explore_finops_kpis tool to browse the KPIs grouped by FinOps domain. The point is to meet people where they are: you run a normal scan, and the tool quietly connects what it found to the metrics the FinOps community actually tracks, so you can learn the framework as you go instead of having to know it first. It never makes up a number; if it can't compute a KPI from your data, it flags the correlation and points you at the scan that would.
Automated Function
Headless and scheduled, and for a lot of organizations this is the natural next step after the GUI. You start with the GUI to see where you stand and fix the obvious stuff by hand. Once you know the scan is giving you the right picture, you stop running it manually and let it run itself. The automated edition deploys as an Azure Function on a timer, scans unattended, and hands off the results with no human in the loop.
There are two reasons it tends to run faster than a manual scan. First, it runs inside Azure, so it talks to the Cost Management plane, Resource Graph, and your hub storage directly over the Azure backbone instead of a laptop reaching across the public internet. That proximity to the data plane cuts real latency out of every call. Second, it skips all the interactive overhead: no browser login, no tenant or subscription picker, no UI rendering. It authenticates with its own managed identity and goes straight to work, which also makes it more reliable run over run.
And it doesn't just scan and sit there. On the schedule you set, it can drop a rich, self-contained HTML report straight into your inbox, the same kind of report you'd export from the GUI, delivered to whoever needs it (your CFO, your FinOps team, a distribution list) without anyone logging in to go get it. Set the recipients once and the posture report just shows up after every run.
The part I want to call out: this is a great fit for organizations that don't use AI tooling, or that don't allow MCP servers in their environment. You get continuous, hands-off FinOps monitoring with nothing but an Azure Function and your existing RBAC. No agents, no external model calls, no new attack surface to review. If you want a recurring posture report or drift detection but the MCP route is off the table, this is the one to deploy.
| If you want to... | Run the |
|---|---|
| Sit down and work through findings, fixing as you go | GUI |
| Run a quick scan from a shell, a Mac, or Cloud Shell | TUI |
| Ask questions in natural language or drive it from an agent | MCP server |
| Scan on a schedule with nobody watching (no AI required) | Automated function |
Where the Data Comes From
This is the biggest change under the hood, and it matters for both speed and accuracy.
By default, the tool now reads cost data from your FinOps Hub data model or Cost Management exports when one is in scope. Exported data is already conformed, deduplicated, and sitting in storage, so reading it is faster, cheaper, and gives you real history without hammering the Cost Management Query API (which throttles hard and only reaches back so far). If you've invested in a hub or set up exports, the Multitool takes advantage of it automatically.
When there's no hub or export to read, it falls back to the live Cost Management APIs. You still get a complete scan, it just queries Azure directly instead of reading the data model. There's nothing to configure. It detects what's available and picks the better source.
And some things always come from live APIs because they aren't in the export at all. Forecasting is the clearest example: the forecast comes straight from the Cost Management forecast endpoint. The same goes for current-state inventory like orphaned resources, idle VM metrics, tag coverage, and Advisor recommendations. So even when the bulk of your cost data is coming from an export, the tool still reaches out to the APIs to complement it and round out the picture.
The short version: export or hub first for cost history, live APIs to fill the gaps and add things like forecasting. You get the depth of the data model with the freshness of live queries where it counts.
Key Features and Capabilities
Comprehensive Tenant Scanning
The tool provides deep visibility across your entire Azure estate. Cost data reads from your FinOps Hub or Cost Management exports by default and falls back to the live APIs listed below when no export is in scope (more on that further down):
| Area | Data Source | What You Get |
|---|---|---|
| Hierarchy | Management Groups API | Full MG tree with subscriptions and inline costs |
| Costs | Cost Management API | Month-to-date actual costs + forecasts per subscription |
| Cost Trend | Cost Management API (6 months) | Bar chart showing monthly spend over the last 6 months |
| Cost Anomalies | Trend analysis | Subscriptions with 25%+ month-over-month cost changes |
| Cost Management Alerts | Cost Management Alerts + Scheduled Actions API | Triggered anomaly/budget/forecast alerts plus configured anomaly alert rules |
| Resource Costs | Cost Management API (per sub) | Per-resource spend with type, RG, forecast, % of total |
| Contract | Billing Accounts API + ARM quotaId | EA, MCA, PAYG, or CSP detection with quotaId fallback |
| Tag Inventory | Azure Resource Graph | Every tag name/value in use, untagged resource count |
| Cost by Tag | Cost Management API | Spend broken down by CAF allocation tags with auto-backfill |
| Tag Deploy | ARM Tags API (PATCH merge/delete) | Inline Add/Remove buttons per tag; deploy or remove tags from subscriptions or RGs |
| Tag Recommendations | CAF baseline | Gap analysis against 7 CAF allocation tags with deployment location |
| AHB | Azure Resource Graph | Windows VMs, SQL VMs, and SQL DBs missing Hybrid Benefit |
| Commitments | Reservation Summaries + Benefit Utilization API | RI and Savings Plan utilization %, underutilized commitments |
| Orphaned Resources | Azure Resource Graph (6 KQL queries) | Orphaned disks, unattached IPs/NICs, deallocated VMs, empty ASPs, old snapshots, with MTD cost and estimated annual waste |
| RI / SP Recommendations | Advisor + Reservation Recs API | RI and SP recs with Actual (MTD), Forecast, and savings |
| Advisor | Azure Advisor (Cost category) | Rightsize, shutdown, delete, modernize recs with cost data |
| Budget Status | Consumption Budgets API | Budget vs actual per subscription, % used, risk level; deploy budgets with up to 4 custom thresholds |
| Savings Realized | Cost Management (ActualCost + AmortizedCost) | Monthly savings from existing RIs, Savings Plans, and AHB |
| Policy Inventory | ARM Policy Assignment API + Resource Graph | All effective policy and initiative assignments including MG-inherited, with compliance state |
| Policy Recommendations | CAF-aligned built-in policies | Missing cost, tagging, security, and monitoring policies with deploy-from-GUI capability |
| Policy Deploy / Unassign | ARM Policy Assignment API | Inline Deploy/Unassign buttons per policy in the recommendations grid |
| Policy Remediation | Policy Insights API | Trigger remediation tasks for DeployIfNotExists/Modify policy assignments |
| Budget Policy | ARM Policy Assignment API | Deploy budget enforcement policies at subscription or MG scope |
| Billing | Billing Accounts/Profiles API | Billing accounts, profiles, invoice sections, EA departments |
| MACC | Consumption Lots API (billing-account scope) | Microsoft Azure Consumption Commitment readout: commitment, consumed, remaining, % burned, and status (EA + MCA) |
| Cost Allocation | Cost Management Allocation API | Existing cost allocation rules with source/target counts |
| Idle VMs | Azure Monitor Metrics (14-day) | Running VMs with <5% CPU and minimal network activity; catches optimization candidates Advisor may miss |
| Storage Tiers | Azure Monitor Metrics (30-day) | Hot-tier storage accounts with low transaction activity, flagged as candidates for Cool or Archive migration |
| Scorecard | All of the above | Per-subscription health: cost, tags, optimizations, orphan savings, budget, trend |
| FinOps Guidance | All of the above | FinOps Maturity Score (0–100) with weighted category breakdown and actionable advice |
| Resources | Curated links | FinOps Framework, Cost Management docs, Azure Workbooks, orphaned resources workbook |
| Data Export | Local File System | HTML reports, CSV exports, and Power BI template files (.pbit) with pre-built 4-page dashboard |
Tagging Health & Management
- Tag Inventory: Complete view of all tags in use across your tenant
- Untagged Resources: Identify resources missing critical tags
- Cost by Tag: Spend analysis broken down by CAF allocation tags with auto-backfill and last-month fallback
- Tag Deployment: Inline tag management with add/remove capabilities for subscriptions, resource groups, and individual resources
- Mass Tag Removal: Remove a tag from a subscription and all its resource groups in a single click; scope extended to individual resources via Resource Graph
- Tag Removal Value Filter: Filters removal candidates by actual tag value to prevent accidental deletions
Management & Deployment
- Policy Management: Deploy and manage Azure policies across subscriptions; unassign individual policies or mass-unassign all assignments of the same policy in one action
- Policy Remediation: Trigger remediation tasks for DeployIfNotExists and Modify policy assignments directly from the GUI
- Budget Deployment: Create and configure budgets with up to 4 custom thresholds (Actual and Forecasted), with Action Group integration for alert routing
- Bulk Operations: Deploy tags, policies, and budgets across multiple subscriptions simultaneously
Cost Optimization Opportunities
- Azure Hybrid Benefit (AHB): Identify Windows VMs, SQL VMs, and SQL DBs missing licensing optimizations
- Reservations & Savings Plans: Utilization analysis and underutilized commitments
- Orphaned Resources: Find and quantify waste from unused disks, IPs, NICs, VMs, and snapshots
- Idle VM Detection: 14-day Azure Monitor metrics flag running VMs with <5% CPU that Advisor missed
- Storage Tier Optimization: Hot-tier storage accounts with low activity flagged for Cool/Archive migration (50–90% savings)
- Rightsizing Recommendations: Advisor-driven suggestions for better resource sizing
- Budget Monitoring: Budget vs. actual analysis with custom threshold alerts
FinOps Maturity Scorecard
Get a per-subscription health assessment covering:
- Cost management effectiveness
- Tagging compliance
- Optimization opportunities
- Orphaned resource cleanup potential
- Budget adherence
- Spend trend analysis
Data Export & Visualization
- HTML Reports: Export comprehensive reports for sharing and documentation
- CSV Export: Export data for analysis in Excel or other tools
- Power BI Support: Choose between:
- 16 Structured CSVs: Pre-formatted data files optimized for Power BI analysis covering costs, tags, policies, optimization opportunities, and more
- Power BI Templates (.pbit): Ready-to-use Power BI template files with pre-built visualizations and reports for immediate analysis
- Unified Export Dialog: Single interface for all export formats with configurable options
Why Use It?
No platform to set up, no dashboards to build first. Run it once and you'll have a real picture of your Azure environment in minutes: costs, tagging gaps, orphaned resources, and optimization opportunities all in one place. Run the GUI on Windows, the TUI from a Mac or Cloud Shell, point an agent at the MCP server, or schedule the function. Same answers, your choice of door.
If you're new to FinOps, it's a practical starting point before investing in heavier tooling. It shows you what to look at and gives you something concrete to act on. If you're already doing FinOps work, it's useful for quick cross-subscription spot checks, sizing up opportunities before an engagement, or wiring recurring checks into automation.
It doesn't replace Azure Cost Management, FinOps Toolkit, or Power BI. It reads from them where it can and gets you answers faster when you need them.
Getting Started with the GUI
The walkthrough below covers the Windows GUI, since that's the most hands-on edition. The TUI runs the same scans from any PowerShell 7 terminal (including macOS and Linux), the MCP server is launched as a tool endpoint for your agent, and the automated function runs on a timer once deployed.
Prerequisites
- Windows with PowerShell 5.1+ for the GUI (the TUI runs cross-platform on PowerShell 7)
- Az PowerShell modules:
Az.Accounts,Az.Resources,Az.ResourceGraph,Az.CostManagement,Az.Advisor,Az.Billing - Azure RBAC: Reader + Cost Management Reader on target scope (minimum for scanning)
Install modules if needed:
Install-Module Az.Accounts, Az.Resources, Az.ResourceGraph, Az.CostManagement, Az.Advisor, Az.Billing -Scope CurrentUser
Installation & Usage
-
Clone the repository:
git clone https://github.com/z-larsen/Azure-FinOps-Multitool.git cd Azure-FinOps-Multitool -
Unblock downloaded files (required on Windows for files from the internet):
Get-ChildItem -Path .\AzureFinOpsMultitool -Recurse | Unblock-File -
Run the tool:
.\Start-FinOpsMultitool.ps1 # Or bypass execution policy without changing system settings: powershell -ExecutionPolicy Bypass -File .\Start-FinOpsMultitool.ps1 -
Click Commercial Tenant (or Gov Tenant for Azure Government). A browser login opens, then a tenant picker dialog lists all accessible tenants.
-
If your tenant has more than 5 subscriptions, a subscription selector dialog appears. Choose which subscriptions to scan or select all, then click OK.
-
Click Scan. The tool runs through 23 data-collection stages with a progress bar.
-
Browse the tabs when the scan completes:
- Overview: cost summary cards, savings realized, budget status, subscription cost table with orphan savings, top resources by spend, scorecard
- Cost Analysis: 6-month cost trend bar chart, cost anomaly flags (25%+ MoM change), Cost Management alerts (triggered + configured rules), spend by tag value
- Tags: tag inventory with coverage %, CAF compliance check, inline Add/Remove buttons to deploy or remove tags on subscriptions/RGs/individual resources
- Policy: effective policy inventory with compliance %, CAF-recommended policies, inline Deploy/Unassign buttons, remediation tasks for DINE/Modify policies
- Optimization: RI/SP utilization, orphaned resources with cost and estimated annual waste, idle VM detection (14-day metrics), storage tier advice, AHB gaps, RI/SP recs, Advisor recs
- Billing: billing accounts, billing profiles (MCA), invoice sections, EA departments, MACC consumption readout, cost allocation rules
- FinOps Guidance: FinOps Maturity Score (0-100) with pillar-by-pillar assessment
- Resources: curated links to FinOps Framework, Cost Management, Azure Workbooks, and more
-
Click Export Scan Results to save as HTML, CSV, or Power BI template (.pbit)
Use Cases & Scenarios
Initial FinOps Assessment
The classic cold start. A new practitioner, or a consultant joining an engagement, needs the full picture fast. Run the GUI for an interactive walkthrough, or the TUI if you're on a Mac or in Cloud Shell. One scan and you know where to focus.
Quarterly Cost Reviews
Use the trend analysis and anomaly detection to spot cost changes and chase down root causes. If you've got a hub or exports, the trend reads straight from the data model, so you get real history without API throttling. The GUI shines here for the visuals and the Power BI export.
Continuous Monitoring
Don't wait for the quarterly review to find a problem. Once you've used the GUI to confirm the scan tells you what you need, deploy the automated function as the next step: point it at your tenant on a schedule and let it catch cost drift, new orphaned resources, and budget risk between reviews. Each run can email a rich HTML posture report straight to your inbox, so stakeholders get the picture without lifting a finger. It runs faster than a manual scan because it lives inside Azure, hitting the Cost Management plane and storage directly over the backbone and skipping all the interactive login and UI overhead, and because it's just a Function with a managed identity, it's a clean fit for organizations that don't use AI tooling or don't allow MCP servers in their environment.
Agent-Driven FinOps
Wire the MCP server into Copilot or your own agent and ask in plain language: "what's my cost per vCPU this month," "where are my biggest orphans," "which VMs are idle." The agent runs the scan and, if you let it, remediates behind the safety gate.
Migration and Budget Planning
Before you move workloads or set next year's budget, get a clean baseline and a forecast. The tool pulls current spend from your export or hub and layers the live forecast on top, so the numbers reflect both where you've been and where you're heading.
Optimization Validation
After you've made cost-saving changes, scan again to quantify the impact and surface the next round of opportunities. Run it interactively in the GUI, or schedule the function to track savings over time.
Architecture & Security
Security First
- Scanning is read-only. Any change (deploying a tag, policy, or budget, or remediating a resource) is explicit and user-initiated.
- Write-safety gate on the MCP server. Remediation tools run behind guardrails: write modes (read-only, interactive, enforced), protected tags, resource groups, and subscriptions, blast-radius limits, and an audit log. Reversible actions come first; irreversible ones need explicit confirmation.
- No data storage. Analysis runs against your tenant and the results stay with you.
- Microsoft Entra authentication. It uses your existing Azure credentials and honors your RBAC.
- Security hardening. KQL injection escaping on Resource Graph queries, token redaction in logs and diagnostics, and scope validation.
Technical Architecture
- Shared PowerShell scan engine across all four editions
- WPF for the Windows GUI; the TUI runs cross-platform on PowerShell 7
- MCP server over stdio JSON-RPC for AI agents
- Azure Function host for scheduled, unattended runs
- FinOps Hub and Cost Management exports as the default cost data source, with the live Cost Management APIs as fallback and for forecasting
- Azure Resource Graph for inventory, Azure Advisor for recommendations, Azure Monitor for idle and usage metrics, and Management Group APIs for hierarchy
Where It's Headed
The scan engine is in a good place. Most of the roadmap now is about meeting people where they work and going further on action, not just analysis.
- Hosted MCP with Entra sign-in. Today the MCP server runs as a local process. The plan is a hosted version any user can reach from any platform, signing in with their own Entra identity and their own RBAC, so a team can share one secure endpoint instead of everyone running it locally. The write-safety gate comes along for the ride.
- More remediation, same guardrails. The MCP already deallocates idle VMs, enables Hybrid Benefit, and removes orphaned resources behind the safety gate. Expect more one-click and one-prompt fixes added the same careful way: reversible first, irreversible only with explicit confirmation.
- Broader KPI coverage. The first wave of FinOps KPI insights covers the metrics the tool can compute from Azure data today. Next is the rest of the catalog, including the ones that need a little outside context (revenue, general ledger, license counts) so you can fill those in and unlock KPIs like cloud spend as a percentage of revenue.
- Deeper data-model coverage. More scans reading from the hub or export instead of live APIs, so large tenants get faster, fuller results with less throttling.
- TUI and MCP catching up to the GUI. Export parity and more of the remediation surface in the terminal and for agents, so the form factor you pick doesn't cost you features.
Community & Support
The Azure FinOps Multitool is an open-source project released under the MIT License. It's actively maintained and welcomes contributions from the FinOps community.
- Documentation: Comprehensive README with setup instructions
- Issue Tracking: GitHub Issues for bug reports and feature requests
- Feature Requests: Community-driven roadmap
- Contributions: Pull requests welcome
Conclusion
FinOps doesn't have to start with a months-long implementation. The Multitool gives you a clear starting point, run it, see what it finds, and you'll know where to focus.
Open source on GitHub if you want to give it a try.
Disclaimer: This tool is provided as-is under the MIT License. Always review and test in non-production environments first.