Azure Monitoring & Incident Response
In this article
This post covers monitoring, observability, and incident response in Azure: what data to collect, how to query it, and how to build alerts that are actually useful. If you haven't already, start with the Azure Platform Fundamentals overview first.
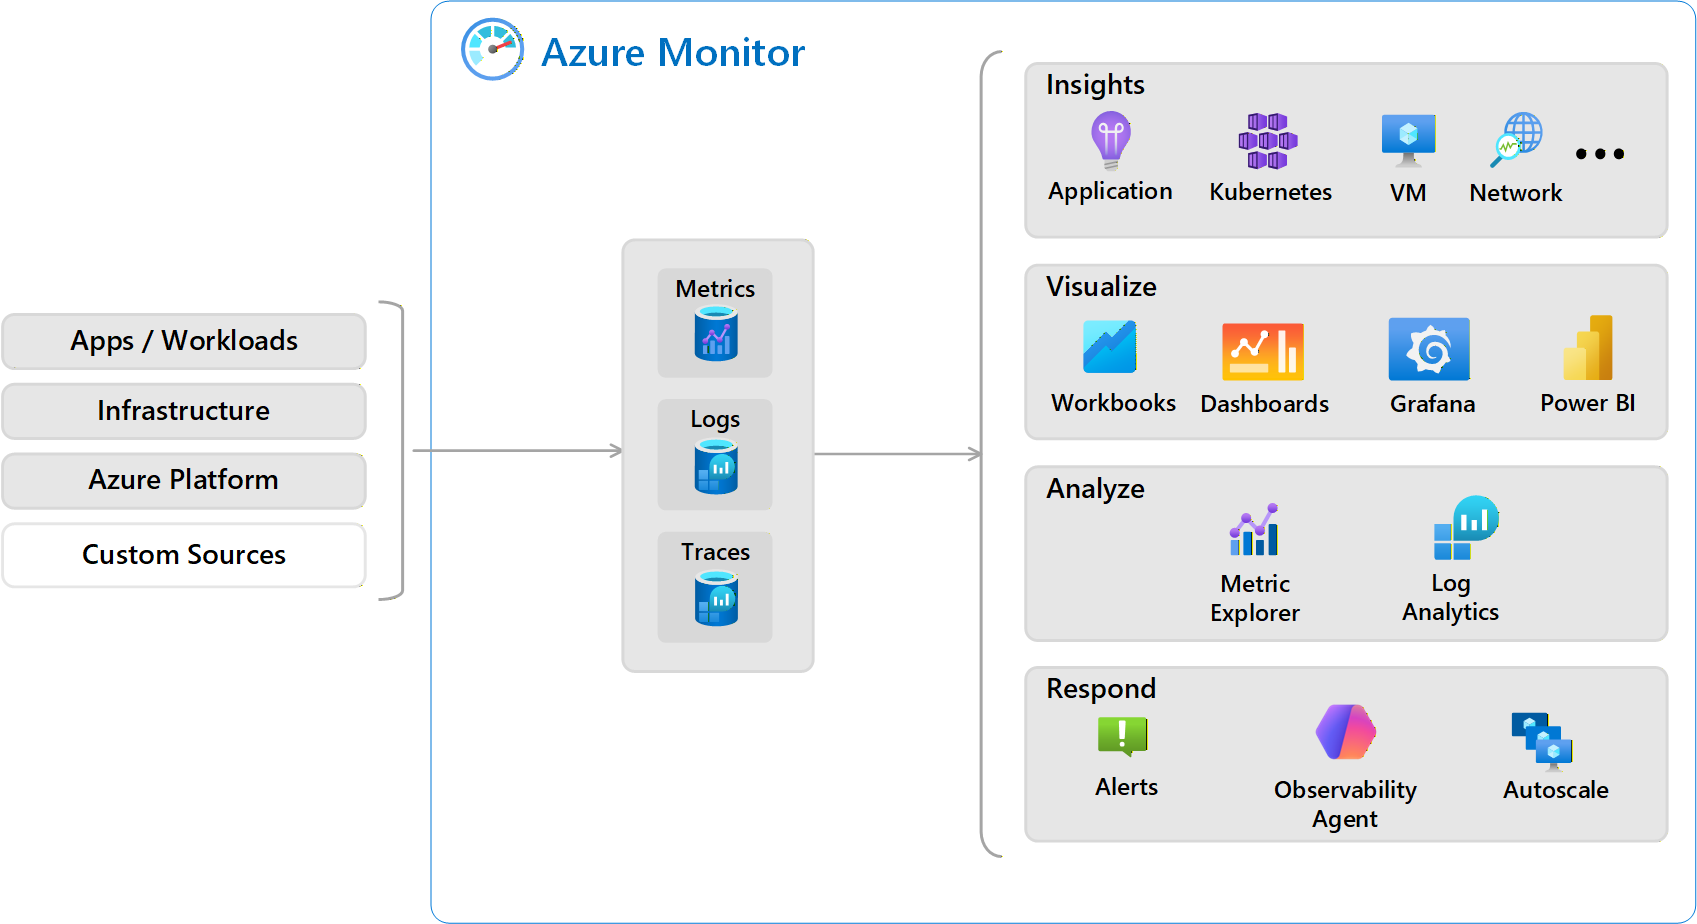
Three Pillars of Observability
To understand what's happening in Azure, you need three types of data.
Metrics: What Is Happening Right Now?
- Time-series numerical data collected automatically at regular intervals
- Lightweight, near real-time (often 1-minute granularity)
- Stored for 93 days by default
- Low cost (included in most services)
Examples: CPU percentage, memory usage, request count, response time, disk IOPS, network in/out.
Use for: Real-time dashboards, performance trending, threshold alerting.
Reference: Azure Monitor Metrics
Logs: What Happened and Why?
- Detailed event records (text/JSON) collected on-demand or on events
- Rich contextual information for troubleshooting
- Retention configurable (30–730 days)
- Queryable with KQL (Kusto Query Language)
- Higher cost (pay per GB ingested)
Examples: Azure Activity Log (who did what?), resource logs (app errors, SQL performance), security logs (sign-in attempts, firewall blocks).
Use for: Troubleshooting failures, security investigations, compliance auditing.
Reference: Azure Monitor Logs
Traces: How Did a Request Flow?
- Distributed tracing across multiple services
- Shows request path with timing: Web → API → Database
- Essential for microservices architectures
Use for: Performance optimization, identifying bottlenecks, understanding dependencies.
Tool: Application Insights (part of Azure Monitor)
Reference: Distributed Tracing
Comparison
| Signal | What | When Collected | Retention | Best For | Cost |
|---|---|---|---|---|---|
| Metrics | Numerical values | Every 1 min | 93 days | Dashboards, alerts | Low |
| Logs | Event records | On event | 30–730 days | Troubleshooting | Medium |
| Traces | Request flows | On request | Varies | Performance tuning | Medium |
Diagnostic Settings
By default, most Azure resources do not send logs anywhere. You must configure diagnostic settings to enable log collection.
How They Work
- Choose the resource — VM, Storage Account, Key Vault, etc.
- Select which logs/metrics to collect — Each resource has different log categories
- Choose a destination:
- Log Analytics Workspace — Centralized storage, query with KQL
- Storage Account — Long-term archival, cheap
- Event Hub — Stream to external SIEM/analytics
- Partner Solutions — Splunk, Datadog, etc.
Most common: Log Analytics Workspace (enables querying and alerting).
Example
Resource: production-keyvault
Log categories: AuditEvent (who accessed secrets)
Destinations:
  → Log Analytics Workspace (for querying/alerting)
  → Storage Account (for 7-year compliance retention)
Important
- Diagnostic settings are per-resource — 100 VMs means configuring diagnostics 100 times
- Use Azure Policy to automate diagnostic settings at scale
Reference: Diagnostic Settings
Log Analytics Workspace
A centralized repository for collecting, storing, and querying logs from Azure resources.
Key characteristics:
- One workspace can collect logs from multiple subscriptions/resources
- Logs stored in predefined tables
- Query using KQL (similar to SQL)
- Retention: 30–730 days
- Pricing: ~$2–3 per GB ingested
Common Tables
| Table | Contents |
|---|---|
| AzureActivity | Subscription-level events (resource creation/deletion) |
| SecurityEvent | Windows security events (login failures, privilege escalation) |
| Syslog | Linux system logs |
| AppExceptions | Application errors from Application Insights |
| AzureDiagnostics | Resource-specific logs (Key Vault, Storage) |
Sample KQL Queries
Failed login attempts in the last 24 hours:
SecurityEvent
| where TimeGenerated > ago(24h)
| where EventID == 4625
| summarize FailedAttempts = count() by Account
| order by FailedAttempts desc
Key Vault access by user:
AzureDiagnostics
| where ResourceType == "VAULTS"
| where OperationName == "SecretGet"
| summarize AccessCount = count() by CallerIPAddress, identity_claim_upn_s
VMs with high CPU in the last hour:
Perf
| where TimeGenerated > ago(1h)
| where CounterName == "% Processor Time"
| where CounterValue > 80
| summarize avg(CounterValue) by Computer
Reference: Log Analytics Overview, KQL Tutorial
Workspace Design
| Pattern | Description | Pros | Cons |
|---|---|---|---|
| Single workspace | All resources → one workspace | Unified view, cross-resource queries | Harder to separate costs |
| Multiple workspaces | Separate by environment/security | Clear RBAC boundaries, cost separation | Cannot query across easily |
Most common: One workspace per environment (prod/non-prod), with a separate security workspace for SIEM.
Alerting (Signals → Alerts → Actions)
Alerts automatically notify teams when conditions are met, enabling faster incident response.
Alert Components
1. Alert Rule: What to monitor and when to alert
- Target resource, signal (metric or log query), condition/threshold, evaluation frequency
2. Action Group: Who to notify and how
- Email, SMS, voice call, webhook (PagerDuty, Teams), Azure Function, Logic App, ITSM connector
3. Alert Lifecycle: State progression
- Fired — Condition met, notification sent
- Acknowledged — Team is working on it
- Resolved — Condition no longer met (auto or manual)
Alert Types
| Type | Evaluation | Example |
|---|---|---|
| Metric Alerts | Fast (within minutes) | CPU > 80%, disk < 10 GB |
| Log Alerts | Slower (5–30 min), KQL-based | Failed logins > 5 in 10 min |
| Activity Log Alerts | Control plane events | Resource deleted, role assignment changed |
| Service Health Alerts | Azure platform issues | Region outage, planned maintenance |
Best Practices
- Set meaningful thresholds to avoid alert fatigue
- Use action groups for team/shift-based routing
- Include runbook links in alert descriptions
- Review and tune alerts quarterly
Reference: Azure Monitor Alerts
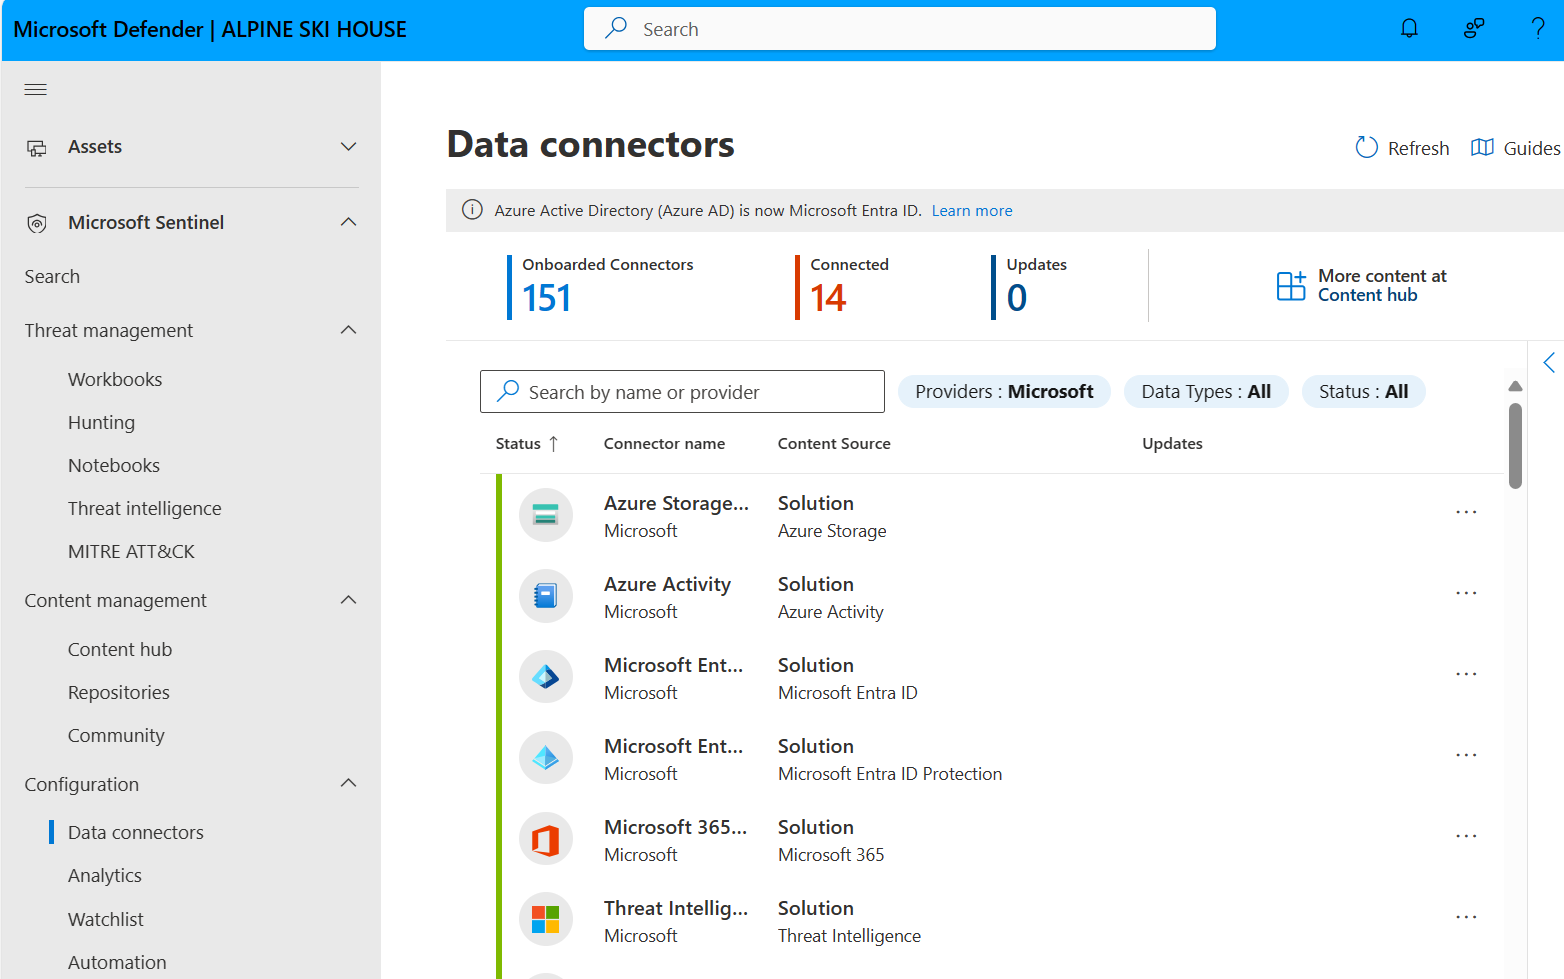
SIEM Basics: Microsoft Sentinel
A SIEM collects security logs from multiple sources, correlates events, and detects threats.
What Sentinel Does
- Collects logs from Azure, on-premises, and other clouds
- Uses machine learning to detect anomalies
- Provides pre-built threat detection rules
- Automates incident response (SOAR capabilities)
Architecture
Azure Resources → Diagnostic Settings → Log Analytics Workspace
                                              ↓
                                     Microsoft Sentinel
                                              ↓
                          Security Analysts investigate incidents
Common Data Sources
- Microsoft Entra ID sign-in logs (identity threats)
- Azure Activity Logs (suspicious resource changes)
- Firewall logs (network threats)
- Office 365 logs (email phishing)
- Windows Security Events (endpoint threats)
Pre-Built Detections
- Multiple failed login attempts (brute force)
- Mass deletion of resources (malicious insider)
- Access from anonymous IPs or Tor network
- Privilege escalation attempts
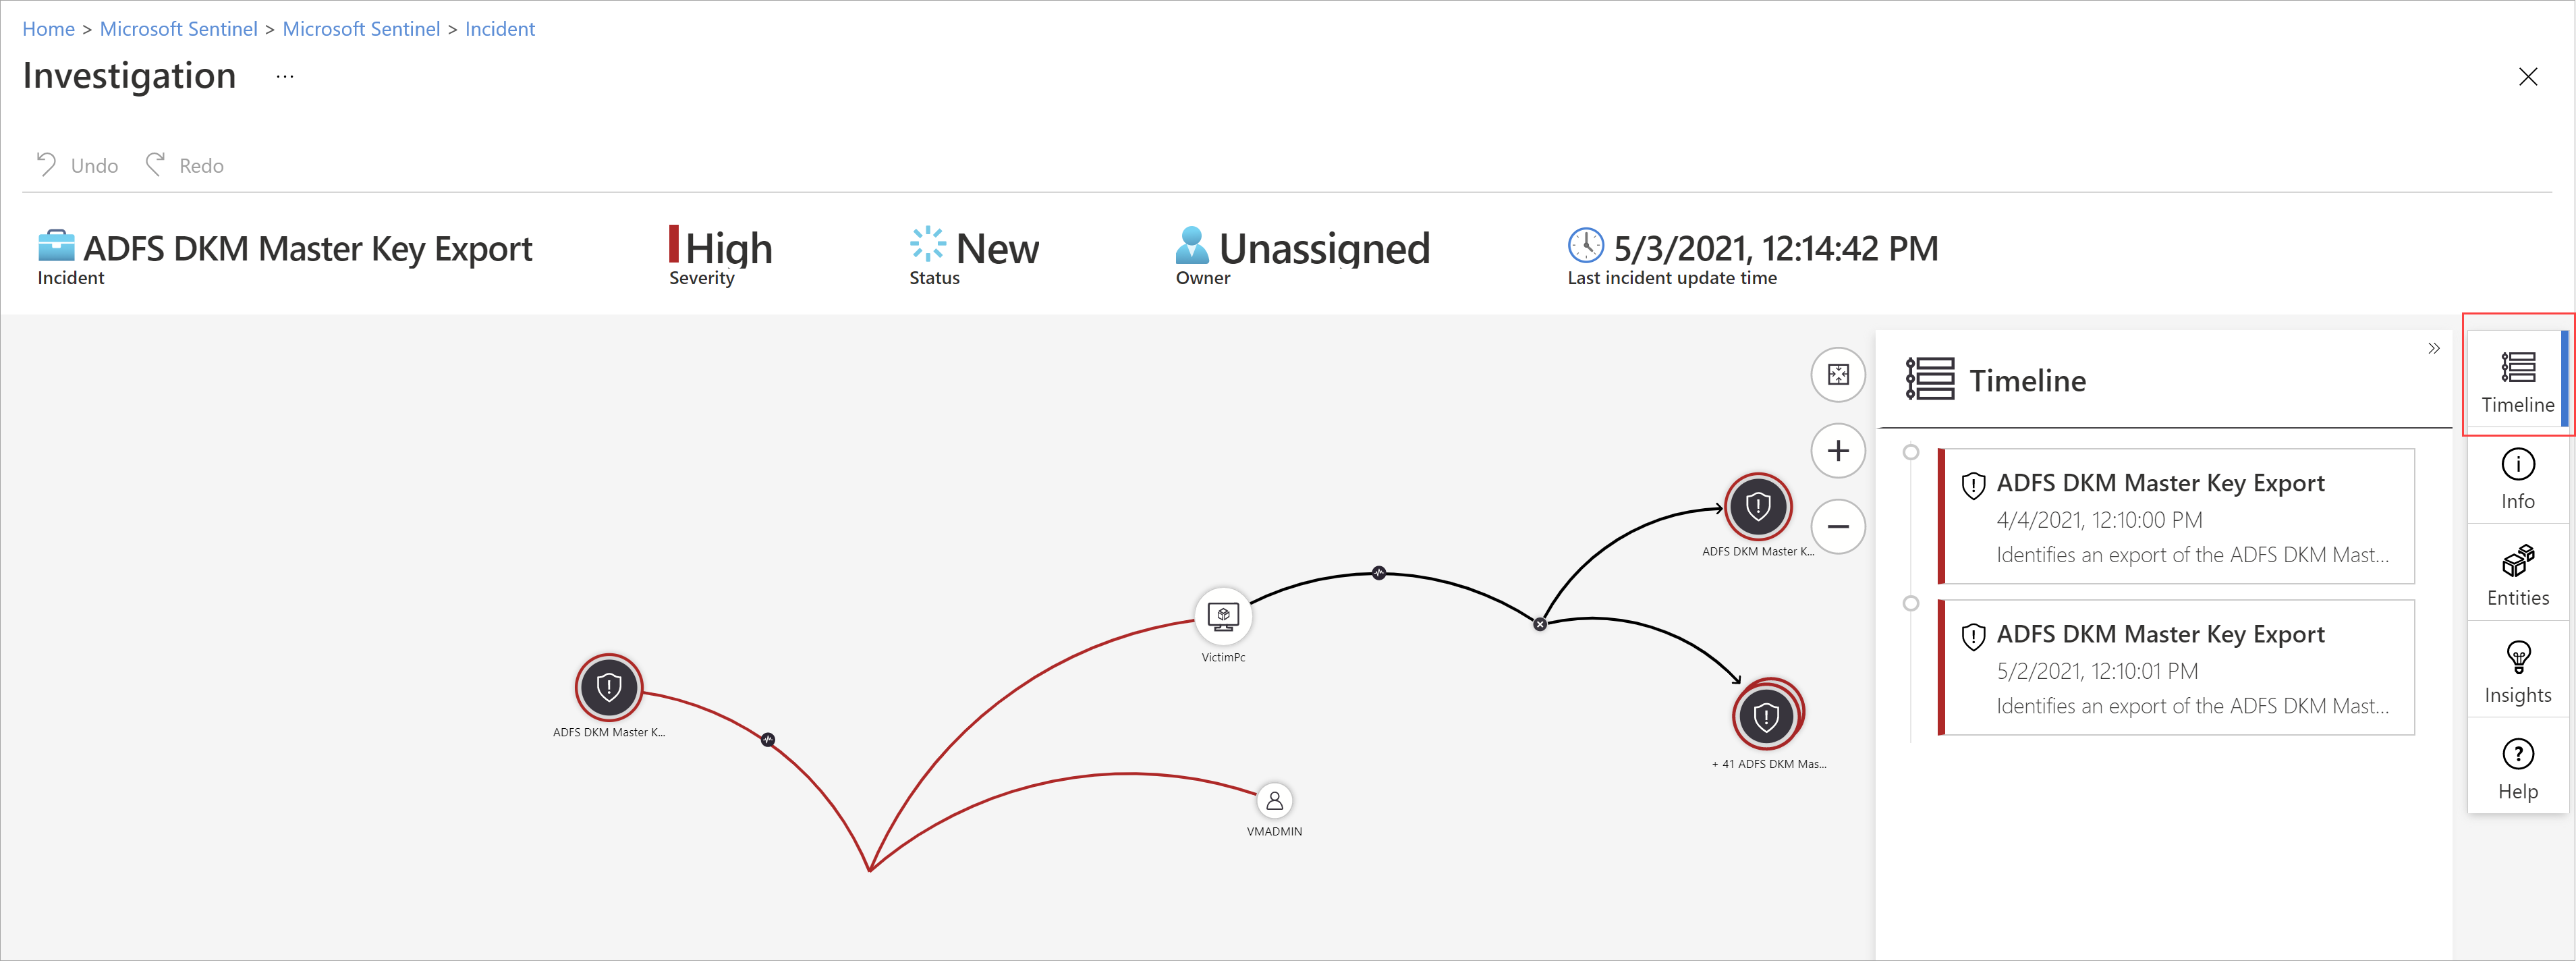
Incident Workflow
- Sentinel detects suspicious activity
- Creates incident (groups related alerts)
- Assigns to security analyst
- Analyst investigates using built-in investigation graph
- Analyst takes action: block IP, disable account, etc.
- Analyst closes incident with resolution notes
Pricing
- Sentinel is built on top of Log Analytics (pay per GB ingested for logs + additional Sentinel charge for threat detection)
- Optimization: Only send security-relevant logs to the Sentinel workspace
Reference: Sentinel Overview
Shared Incident Response Responsibilities
Monitoring and incident response is a shared responsibility between platform teams and workload owners.
Responsibility Matrix
| Incident Type | Platform Team | Business Unit |
|---|---|---|
| Azure region outage | LEAD | Informed |
| VNet connectivity issue | LEAD | Assists |
| Security breach (compromised credential) | LEAD | Assists |
| Application-specific errors | Assists | LEAD |
| Database performance issues | Assists | LEAD |
| VM performance degradation | Assists | LEAD |
| Cost anomaly (unexpected spike) | Monitors | LEAD |
| Compliance violation | LEAD | Jointly |
Platform Team Monitors
- Azure Service Health, subscription-level activity
- Network security group changes, RBAC assignments
- Microsoft Defender for Cloud alerts, cost anomalies, compliance posture
Business Units Monitor
- Application availability and performance
- Business logic errors and exceptions
- Resource-specific metrics (VM CPU, database DTU)
- User-reported issues
Key principle: The team that owns the resource owns the incident response, with support from other teams as needed.
Key Takeaways
- Monitor with all three pillars: metrics (real-time), logs (context), traces (flow)
- Diagnostic settings are per-resource — automate with Azure Policy
- Use Log Analytics + KQL as your centralized query engine
- Design alerts to be actionable, not noisy
- Sentinel adds threat detection on top of Log Analytics
- Define clear incident response boundaries between platform and workload teams
Additional Resources
- Azure Monitor Overview
- Diagnostic Settings
- Log Analytics Overview
- KQL Quick Reference
- Azure Monitor Alerts
- Microsoft Sentinel
This is part of the Azure Fundamentals Series. Return to the main guide to explore other topics.