Azure Connectivity Troubleshooting: Tools, Logs, and How to Actually Diagnose Problems
In this article
Azure Connectivity Troubleshooting: Tools, Logs, and How to Actually Diagnose Problems
When a connectivity issue shows up in Azure, the instinct is to start poking around in the portal hoping something obvious jumps out. That works occasionally. More often you end up clicking through resource after resource without a clear read on where the problem actually is.
The reason it feels hard is that traffic in Azure doesn't just flow from point A to point B. Before a packet reaches your app, it can pass through a Front Door, hit a WAF, cross into a virtual network, get evaluated by a UDR, pass through an Azure Firewall, hit another NSG, get forwarded by an Application Gateway, and finally arrive at a backend VM. Any one of those can be the thing dropping your traffic. And each one has its own logs, its own diagnostic tools, and its own way of telling you what happened.
This post covers the tools and logs for each layer, how to use them, and a mental model for working through problems without guessing.
Build the Traffic Map First
Before touching a single tool, sketch the path your traffic actually takes. Even rough and on paper. Something like:
Client request > Front Door > WAF policy > Origin routing > VNet peering > Azure Firewall > UDR in subnet > NSG on NIC > Application Gateway > Backend pool > VM
Every hop is a potential problem. If you skip this step and start random troubleshooting, you will almost certainly waste time checking things that couldn't possibly be the issue.
The two questions to carry through every step: Is traffic reaching this layer? And if it is, is it being allowed through?
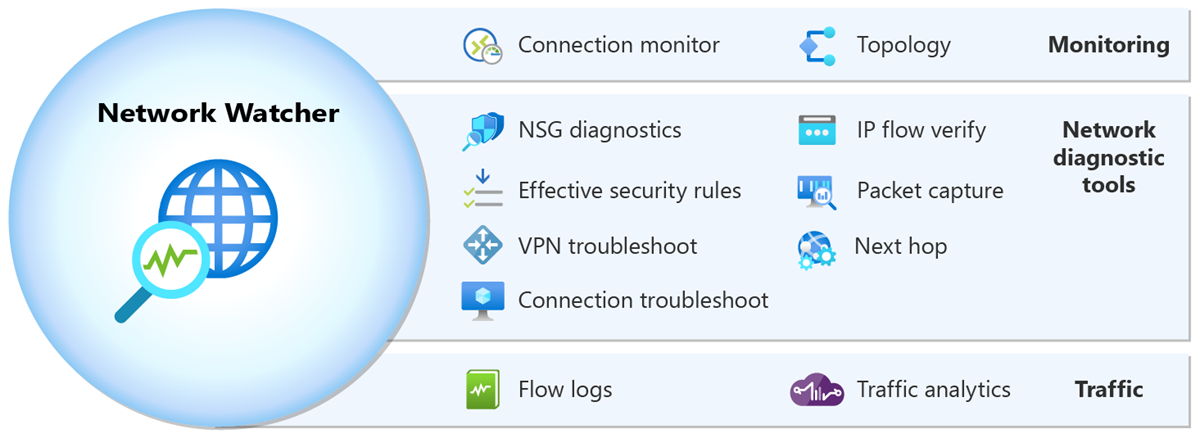
Network Watcher: Your Starting Point for Most Problems
Azure Network Watcher is the first place to go for anything involving VMs, virtual networks, NSGs, or routing. It's a suite of tools, not a single thing, and each one answers a different question.
IP Flow Verify
This is your NSG debugger. You give it a VM, a direction (inbound or outbound), source IP, destination IP, and port. It tells you whether the current NSG rules would allow or deny that traffic, and which specific rule is responsible.
It only evaluates NSG rules. It doesn't know about Azure Firewall, UDRs, or anything else. But if you're trying to figure out whether an NSG is the culprit, this answers it in seconds.
Find it in the portal under Network Watcher > IP flow verify, or via CLI:
az network watcher test-ip-flow \
  --vm <vm-name> \
  --resource-group <rg> \
  --direction Inbound \
  --local <vm-private-ip>:443 \
  --remote <source-ip>:0 \
  --protocol TCP
Next Hop
Next Hop tells you what Azure would do with a packet leaving a specific VM NIC headed to a specific destination IP. It returns the next hop type and the IP of the next hop device.
This is the tool for routing problems. If traffic is going to the wrong place, or not routing through your firewall when it should be, Next Hop will show you what effective route is being used. It's not evaluating firewall rules or NSGs; it's showing you the routing decision.
az network watcher show-next-hop \
  --vm <vm-name> \
  --resource-group <rg> \
  --source-ip <vm-ip> \
  --dest-ip <destination-ip>
Effective Routes
Effective Routes gives you the full routing table as it actually applies to a given NIC. It shows system routes, routes from peered VNets, and any UDRs you've applied, merged into the final effective set. If you're suspicious about a UDR doing something unexpected, this is where you confirm it.
In the portal: navigate to the VM's NIC, then under Support + troubleshooting, look for Effective routes.
Effective Security Rules
Similar to Effective Routes but for NSGs. It shows you all the NSG rules from the subnet-level NSG and the NIC-level NSG merged into the final evaluated set. Handy when you have both applied and aren't sure which rule is actually winning.
Connection Troubleshoot
Connection Troubleshoot goes a level above IP Flow Verify. It actually attempts a connection from a VM to a destination (by IP or FQDN) and tells you whether it succeeded, and if not, where it failed. It uses the Network Watcher extension installed on the VM.
It can identify issues at the NSG level, routing level, or OS firewall level (if the guest firewall is blocking). It won't know about Azure Firewall in the data path unless you're routing through it and the firewall is what's dropping the connection, in which case you'll see the probe fail and you'll need to correlate with firewall logs.
Packet Capture
When you need to see the actual packets, Network Watcher can start a capture session on a VM NIC without you needing to RDP in and run Wireshark manually. Captures save to a storage account and you can download and open them in Wireshark.
This is a last resort tool for most issues, but when you genuinely can't tell whether traffic is arriving at a VM at all, packet capture settles the question definitively.
VNet Flow Logs and Traffic Analytics
Virtual network (VNet) flow logs are the current Microsoft-recommended way to capture network traffic visibility in Azure. They replaced NSG flow logs as the standard approach: after June 30, 2025, you can no longer create new NSG flow logs, and NSG flow logs are set to be fully retired on September 30, 2027. If you have existing NSG flow logs, Microsoft recommends migrating to VNet flow logs.
VNet flow logs are more capable than NSG flow logs. They operate at the virtual network level rather than requiring configuration at each NSG, they capture traffic at the VNet scope rather than just the NSG boundary, and they also record encryption state for VNets using virtual network encryption. You enable them through Network Watcher by creating a flow log resource targeting a VNet rather than an NSG.
By default, flow logs write raw data to a storage account. To actually query them, enable Traffic Analytics, which processes the flow data and sends it to a Log Analytics workspace. Traffic Analytics works with both VNet flow logs and NSG flow logs.
Once in Log Analytics, you can query the AzureNetworkAnalytics_CL table. Here's a simple query to find denied flows in the last hour:
AzureNetworkAnalytics_CL
| where TimeGenerated > ago(1h)
| where FlowStatus_s == "D"
| summarize DeniedFlows = count() by SrcIP_s, DestIP_s, DestPort_d, L7Protocol_s
| order by DeniedFlows desc
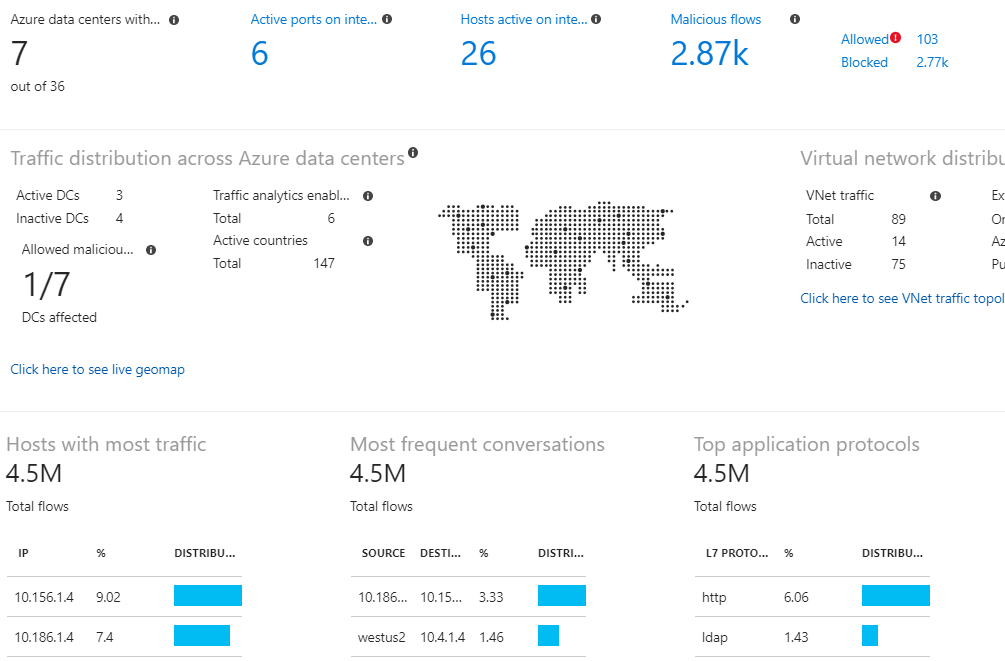
Traffic Analytics also builds a visual map in the portal under Network Watcher showing traffic patterns, top-talking VMs, and geo-distribution of traffic. For an environment you've never seen before, that map is worth opening before diving into queries.
Azure Firewall
Azure Firewall has two logging modes: the older AzureDiagnostics-based logs and the newer structured logs (available in Firewall Premium and now also Standard).
The structured logs are broken out by rule type and much easier to query. The main tables are:
| Table | What's in it |
|---|---|
AZFWNetworkRule |
Network rule evaluations (Layer 4) |
AZFWApplicationRule |
Application rule evaluations (FQDN-based, Layer 7) |
AZFWThreatIntel |
Traffic matched and blocked by threat intelligence |
AZFWIdpsSignature |
Intrusion detection/prevention signatures matched |
AZFWNatRule |
DNAT rule hits |
To find denied network traffic:
AZFWNetworkRule
| where TimeGenerated > ago(1h)
| where Action == "Deny"
| project TimeGenerated, SourceIp, SourcePort, DestinationIp, DestinationPort, Protocol, Policy, RuleCollection, Rule
| order by TimeGenerated desc
To find application rule denies (common when FQDNs are blocked):
AZFWApplicationRule
| where TimeGenerated > ago(1h)
| where Action == "Deny"
| project TimeGenerated, SourceIp, Fqdn, Protocol, Policy, RuleCollection, Rule
| order by TimeGenerated desc
If you're on legacy AzureDiagnostics logging, the approach is similar but noisier. All firewall logs land in the same table and you filter by Category:
AzureDiagnostics
| where Category == "AzureFirewallNetworkRule"
| where msg_s contains "Deny"
| project TimeGenerated, msg_s
| order by TimeGenerated desc
One thing that trips people up: if IDPS is enabled and set to Alert + Deny, traffic can get blocked by IDPS before it even hits a rule. Always check AZFWIdpsSignature when traffic seems to be getting dropped before a rule you'd expect to match it.
UDR Troubleshooting
User-Defined Routes are silent when they're wrong. They don't log, they don't error, the traffic just goes somewhere it shouldn't or loops. The problems I see most often:
Traffic not routing through the firewall. A UDR with 0.0.0.0/0 pointing at the firewall's private IP should catch all egress. But if that route isn't applied to the right subnet, or there's a more specific system route winning, traffic bypasses it. Use Effective Routes on the source VM's NIC to confirm what's actually in the routing table.
Asymmetric routing. Traffic enters through a firewall but the return path doesn't go back through it. The firewall's stateful inspection drops the return traffic because it never saw the original flow. This almost always means you have a UDR on the source subnet but not on the destination subnet, or vice versa. Both sides need routes forcing traffic through the same device.
Peering routes overriding UDRs. BGP routes from an ExpressRoute or VPN gateway can sometimes override UDRs depending on configuration. Check the effective routes table and look for routes with next hop type VirtualNetworkGateway when you expected the UDR to win.
Application Gateway
Application Gateway logs two things: access logs and WAF logs (if WAF is enabled). Both land in AzureDiagnostics with the resource type APPLICATIONGATEWAYS.
Access logs capture every request with client IP, request URI, HTTP status from both App Gateway and the backend, time taken, and backend server used. Useful for confirming requests are arriving and seeing the response chain:
AzureDiagnostics
| where ResourceType == "APPLICATIONGATEWAYS"
| where Category == "ApplicationGatewayAccessLog"
| where httpStatus_d >= 500
| project TimeGenerated, clientIP_s, requestUri_s, httpStatus_d, serverStatus_d, timeTaken_d, backendPoolName_s
| order by TimeGenerated desc
When you see a 502 from App Gateway, there are a few common causes. The backend pool is unhealthy (check the health probe status in the portal under Backend health). The backend is returning a response that doesn't match what App Gateway expects (custom probe settings are wrong). Or the connection to the backend is being blocked by an NSG on the backend subnet (IP Flow Verify the backend NIC from the App Gateway subnet IP range).
WAF logs show every rule evaluation for requests that matched a WAF rule:
AzureDiagnostics
| where ResourceType == "APPLICATIONGATEWAYS"
| where Category == "ApplicationGatewayFirewallLog"
| where action_s == "Blocked"
| summarize BlockCount = count() by clientIp_s, ruleGroup_s, ruleId_s
| order by BlockCount desc
If you're seeing legitimate traffic getting blocked by WAF, the ruleId_s tells you exactly which rule. You can then look that rule ID up and create an exclusion in the WAF policy if it's a false positive.
Front Door
Front Door has different log tables depending on whether you're using classic Front Door or the Standard/Premium SKUs.
For Standard and Premium Front Door (which is what you should be using for anything new), logs land in dedicated tables:
| Table | What's in it |
|---|---|
FrontDoorAccessLog |
All requests, latency, status codes, origin |
FrontDoorWebApplicationFirewallLog |
WAF rule evaluations |
FrontDoorHealthProbeLog |
Health probe results for each origin |
A common Front Door issue is requests hitting WAF and getting blocked without the client knowing why. To find WAF blocks and see which rule triggered:
FrontDoorWebApplicationFirewallLog
| where TimeGenerated > ago(1h)
| where Action == "Block"
| summarize Count = count() by ClientIp_s, RuleGroup_s, RuleId_s, RequestUri_s
| order by Count desc
For latency issues, Front Door access logs include DurationMs which is the total time Front Door spent on the request. If that's high, OriginLatencyMs tells you how much of that was backend latency vs. Front Door processing:
FrontDoorAccessLog
| where TimeGenerated > ago(1h)
| where DurationMs > 3000
| project TimeGenerated, ClientIp_s, RequestUri_s, DurationMs, OriginLatencyMs, HttpStatusCode, OriginName_s
| order by DurationMs desc
For classic Front Door, both log types land in AzureDiagnostics with Category == "FrontdoorAccessLog" and "FrontdoorWebApplicationFirewallLog".
One health probe issue worth knowing: Front Door health probes originate from Azure's edge infrastructure, and if your origin's NSG or Azure Firewall is blocking them, Front Door will mark the origin as unhealthy even though real traffic would work fine. Microsoft's current guidance is to use the AzureFrontDoor.Backend service tag in your NSG inbound rules to allow health probe traffic from Front Door without having to manage specific IP ranges. Check your NSG rules and firewall rules if origins show unhealthy but manual requests to the backend succeed.
KQL as the Connective Tissue
Most of the log sources above end up in Log Analytics. Once they're there, KQL (Kusto Query Language) is how you pull meaningful answers out. You can correlate across tables, build time charts, set up alerts, and save queries as part of workbooks that your team can share.
If you want to go deeper on KQL, how to write effective queries, and a library of queries that cover these and other scenarios, I wrote a dedicated post on that: Azure Log Analytics and KQL: A Practical Guide with Real Queries.
A Real Troubleshooting Workflow
Here is how I actually work through a connectivity problem, in order:
Step 1: Define the exact path. What is the source? What is the destination? What port and protocol? What route should it take? Write this down.
Step 2: Start at the source. From the source VM (or closest resource), run Connection Troubleshoot or Next Hop to confirm the routing decision is what you expect.
Step 3: Check effective routes on the source NIC. If the routing looks wrong, effective routes will show you what route is winning and why. If there's a UDR that's supposed to be applied but isn't, or a more specific route overriding it, you'll see it here.
Step 4: If a firewall is in the path, check firewall logs. Query AZFWNetworkRule or AZFWApplicationRule for denies in the time window you're troubleshooting. If the traffic isn't showing up in the logs at all, it may not be reaching the firewall (routing issue, back to Step 2).
Step 5: Check flow logs. If traffic is getting to the right place but still not making it, VNet flow logs with Traffic Analytics will show denies at the network layer. IP Flow Verify can also confirm NSG-level denies instantly without needing to query logs.
Step 6: Check the receiving end. If traffic is allowed through the network layer, is the backend actually responding? App Gateway backend health, health probe logs, and finally a direct test to the backend IP confirm whether the problem is in the network or the application.
Step 7: Check App Gateway or Front Door logs. If there's a Layer 7 device in the path, its access log will show you whether the request arrived, what response it got from the backend, and what it returned to the client. WAF logs will show if a WAF policy blocked the request.
Most issues turn up by Step 4 or Step 5. Routing and firewall rules account for a large majority of connectivity problems in Azure environments.
Sources: Azure Network Watcher documentation, Azure Firewall structured logs, Traffic Analytics, Application Gateway diagnostics, Azure Front Door logs