Azure Log Analytics and KQL: A Practical Guide with Real Queries
In this article
Azure Log Analytics and KQL: A Practical Guide with Real Queries
Log Analytics is one of those services that most people set up once, maybe send a few things to it, and then mostly ignore until something breaks. Then they open it up, stare at an empty query box, and have no idea where to start. The data is all there. The problem is knowing what to ask for.
This post covers how Log Analytics is structured, which tables are worth knowing, and a set of KQL (Kusto Query Language) queries that are actually useful for day-to-day Azure operations. If you came here from the connectivity troubleshooting post, you'll find the network-specific queries here, and a lot more on top of them.
What Is Log Analytics?
Log Analytics is the query engine and data store inside Azure Monitor. When you enable diagnostic settings on an Azure resource, you're telling Azure to route that resource's logs, metrics, and activity data to one of three places: a Log Analytics workspace, a storage account, or an Event Hub. The workspace is where you go when you want to actually query the data.
A workspace is a single logical container for log data. Everything you send there lands in named tables. You write KQL queries against those tables to find what you need. Workspaces are scoped to a region and a resource group, but you can query across multiple workspaces if needed.
One workspace per environment (dev, staging, prod) is a reasonable starting layout. Don't build one workspace per resource unless you have a specific reason. Cross-workspace queries are possible but add complexity, and having too many workspaces fragments your data and makes alerts harder to manage.
Connecting Resources to a Workspace
Resources don't automatically send logs to a workspace. You have to configure diagnostic settings for each resource, or use Azure Policy to push the configuration at scale.
In the portal, go to any resource and look for Diagnostic settings under the Monitoring section. From there you can select which log categories and metrics to send, and which workspace to route them to. For something like Azure Firewall you'd enable AZFWNetworkRule, AZFWApplicationRule, AZFWThreatIntel, etc. For an Application Gateway, you'd enable ApplicationGatewayAccessLog and ApplicationGatewayFirewallLog.
Azure Activity Log (the subscription-level audit trail) gets connected through the Diagnostic settings for the subscription, not individual resources. Go to Monitor > Activity log > Export Activity Logs to route it to your workspace.
For VMs, logs and metrics flow through the Azure Monitor Agent (AMA). You create a Data Collection Rule (DCR) that defines what the agent should collect and where to send it.
KQL Basics
KQL is a pipe-based query language. You start with a table, apply filters and transformations, and each step is separated by a pipe character. If you've used PowerShell's pipeline or Unix command chaining, the mental model is similar.
A basic query looks like this:
AzureActivity
| where TimeGenerated > ago(24h)
| where OperationNameValue contains "delete"
| project TimeGenerated, Caller, OperationNameValue, ResourceGroup
| order by TimeGenerated desc
Walking through what each line does:
AzureActivityis the table| where TimeGenerated > ago(24h)filters to the last 24 hours| where OperationNameValue contains "delete"filters to rows where the operation name contains that string| project TimeGenerated, Caller, OperationNameValue, ResourceGrouppicks only the columns you want| order by TimeGenerated descsorts newest first
The operators you'll use constantly:
| Operator | What it does |
|---|---|
where |
Filter rows based on a condition |
project |
Select specific columns (like SELECT in SQL) |
extend |
Add a new calculated column |
summarize |
Aggregate data (like GROUP BY in SQL) |
order by |
Sort results |
top N by column |
Return the top N rows by a given column |
join |
Combine two tables |
parse |
Extract structured values from a string |
bin() |
Round timestamps into buckets for time charts |
let |
Declare a variable or subquery you can reuse |
One tip that makes queries more readable: use let to define your time range and reusable values at the top so you only have to change them in one place:
let lookback = 1h;
let targetSubnet = "10.1.2.0/24";
AZFWNetworkRule
| where TimeGenerated > ago(lookback)
| where SourceIp startswith "10.1.2."
| where Action == "Deny"
| project TimeGenerated, SourceIp, DestinationIp, DestinationPort, Rule
Tables Worth Knowing
These are the tables you'll use most often. Some require specific diagnostic settings to be enabled, which is noted:

| Table | What's in it | Requires |
|---|---|---|
AzureActivity |
Subscription-level audit log: all ARM operations, who did what | Activity Log diagnostic settings |
AzureDiagnostics |
Catch-all table for many resources (App GW, classic Firewall, Front Door classic, Key Vault, etc.) | Per-resource diagnostic settings |
AZFWNetworkRule |
Azure Firewall network rule evaluations | Firewall structured logs enabled |
AZFWApplicationRule |
Azure Firewall application rule evaluations | Firewall structured logs enabled |
AZFWThreatIntel |
Azure Firewall threat intelligence matches | Firewall structured logs enabled |
AZFWIdpsSignature |
Azure Firewall IDPS matches | Firewall IDPS + structured logs |
AzureNetworkAnalytics_CL |
Flow log data processed by Traffic Analytics (supports VNet and NSG flow logs; NSG flow logs retiring 2027) | VNet or NSG flow logs + Traffic Analytics |
FrontDoorAccessLog |
Azure Front Door Standard/Premium request logs | Front Door diagnostic settings |
FrontDoorWebApplicationFirewallLog |
Front Door WAF rule evaluations | Front Door WAF diagnostic settings |
Heartbeat |
VM availability heartbeats from AMA/MMA | Azure Monitor Agent on VMs |
Event |
Windows event log entries | AMA + Data Collection Rule |
Syslog |
Linux syslog entries | AMA + Data Collection Rule |
Perf |
VM and container performance counters | AMA + Data Collection Rule |
SecurityEvent |
Windows security events (logon, process creation, etc.) | Microsoft Defender for Cloud or AMA |
AzureDiagnostics is worth a special note. A lot of older resources dump all of their log categories into this one shared table. That means queries against it always need a ResourceType filter and usually a Category filter to narrow down to the resource and log type you care about. It's noisy but it's what you've got for resources that don't have dedicated tables yet.
The Queries
Azure Firewall: Denied Network Traffic
Find all denied flows through the firewall in the last hour, grouped by source and destination:
AZFWNetworkRule
| where TimeGenerated > ago(1h)
| where Action == "Deny"
| summarize DenyCount = count() by SourceIp, DestinationIp, DestinationPort, Protocol, RuleCollection
| order by DenyCount desc
To see the full detail (individual events rather than grouped):
AZFWNetworkRule
| where TimeGenerated > ago(1h)
| where Action == "Deny"
| project TimeGenerated, SourceIp, SourcePort, DestinationIp, DestinationPort, Protocol, Policy, RuleCollection, Rule
| order by TimeGenerated desc
Azure Firewall: Application Rule Denies (FQDN-Based)
When something can't reach an external endpoint and Azure Firewall is in the path, this shows you what's being blocked and by which rule:
AZFWApplicationRule
| where TimeGenerated > ago(1h)
| where Action == "Deny"
| project TimeGenerated, SourceIp, Fqdn, Protocol, Policy, RuleCollection, Rule
| order by TimeGenerated desc
Azure Firewall: Threat Intelligence Hits
This shows traffic that was blocked because the source or destination matched Microsoft's threat intelligence feed:
AZFWThreatIntel
| where TimeGenerated > ago(24h)
| project TimeGenerated, SourceIp, DestinationIp, DestinationPort, Direction, Action, ThreatDescription
| order by TimeGenerated desc
Application Gateway: Error Responses
Find all 4xx and 5xx responses from App Gateway including what the backend server returned. The serverStatus_d is the response code the backend actually gave App Gateway, which helps distinguish App Gateway-level errors from backend-level errors:
AzureDiagnostics
| where ResourceType == "APPLICATIONGATEWAYS"
| where Category == "ApplicationGatewayAccessLog"
| where httpStatus_d >= 400
| project TimeGenerated, clientIP_s, requestUri_s, httpStatus_d, serverStatus_d, timeTaken_d, backendPoolName_s, host_s
| order by TimeGenerated desc
To see a count of errors by status code over time (useful for spotting when something broke):
AzureDiagnostics
| where ResourceType == "APPLICATIONGATEWAYS"
| where Category == "ApplicationGatewayAccessLog"
| where httpStatus_d >= 400
| summarize Count = count() by bin(TimeGenerated, 5m), httpStatus_d
| order by TimeGenerated desc
Application Gateway: WAF Blocked Requests
See which WAF rules are firing most and against which client IPs. High counts from a single IP against a single rule usually means either a legitimate scanner or an attack. High counts from many IPs against the same rule often means a false positive:
AzureDiagnostics
| where ResourceType == "APPLICATIONGATEWAYS"
| where Category == "ApplicationGatewayFirewallLog"
| where action_s == "Blocked"
| summarize BlockCount = count() by clientIp_s, ruleGroup_s, ruleId_s, requestUri_s
| order by BlockCount desc
Front Door: Slow Requests
Find requests where total duration exceeded 3 seconds. OriginLatencyMs tells you how much of that time was backend latency vs. Front Door overhead:
FrontDoorAccessLog
| where TimeGenerated > ago(1h)
| where DurationMs > 3000
| project TimeGenerated, ClientIp_s, RequestUri_s, DurationMs, OriginLatencyMs, HttpStatusCode, OriginName_s
| order by DurationMs desc
Front Door: WAF Blocks
Same concept as App Gateway WAF, but for Front Door's WAF policy:
FrontDoorWebApplicationFirewallLog
| where TimeGenerated > ago(1h)
| where Action == "Block"
| summarize Count = count() by ClientIp_s, RuleGroup_s, RuleId_s
| order by Count desc
VNet Flow Logs: Denied Flows (Traffic Analytics)
Requires VNet flow logs enabled with Traffic Analytics configured. NSG flow logs are being retired (no new NSG flow logs can be created after June 30, 2025; full retirement September 30, 2027), so VNet flow logs are now the recommended path. Both feed into the same AzureNetworkAnalytics_CL table. This query finds traffic that was denied at the network layer:
AzureNetworkAnalytics_CL
| where TimeGenerated > ago(1h)
| where FlowStatus_s == "D"
| summarize DeniedFlows = count() by SrcIP_s, DestIP_s, DestPort_d, L7Protocol_s
| order by DeniedFlows desc
VNet Flow Logs: Top Talkers by Bytes
Useful for spotting unexpected data transfer or identifying which VMs are responsible for most outbound traffic:
AzureNetworkAnalytics_CL
| where TimeGenerated > ago(1h)
| where isnotempty(SrcIP_s)
| summarize TotalBytes = sum(BytesSentFromPublicIP_d + BytesSentToPublicIP_d) by SrcIP_s
| top 10 by TotalBytes
Activity Log: Who Deleted Something
Find all successful delete operations on your subscription in the last 7 days:
AzureActivity
| where TimeGenerated > ago(7d)
| where OperationNameValue endswith "DELETE"
| where ActivityStatusValue == "Success"
| project TimeGenerated, Caller, OperationNameValue, ResourceGroup, _ResourceId
| order by TimeGenerated desc
To find changes to a specific resource type (for example, any change to a network security group):
AzureActivity
| where TimeGenerated > ago(7d)
| where ResourceProviderValue == "MICROSOFT.NETWORK"
| where OperationNameValue contains "NETWORKSECURITYGROUPS"
| where ActivityStatusValue == "Success"
| project TimeGenerated, Caller, OperationNameValue, ResourceGroup, Properties
| order by TimeGenerated desc
VM Availability: Machines Missing Heartbeats
Heartbeat records arrive from the Azure Monitor Agent every minute. If a VM stops sending them, it's either down, disconnected, or the agent stopped. This finds machines that haven't checked in for 5 minutes:
Heartbeat
| where TimeGenerated > ago(24h)
| summarize LastHeartbeat = max(TimeGenerated) by Computer
| where LastHeartbeat < ago(5m)
| project Computer, LastHeartbeat
| order by LastHeartbeat asc
VM Performance: CPU Over 90% for Sustained Periods
Perf
| where TimeGenerated > ago(1h)
| where ObjectName == "Processor" and CounterName == "% Processor Time"
| where CounterValue > 90
| summarize AvgCPU = avg(CounterValue), MaxCPU = max(CounterValue) by bin(TimeGenerated, 5m), Computer
| order by TimeGenerated desc
Key Vault: Access Failures
Useful when apps report issues retrieving secrets and you want to see what's failing and why:
AzureDiagnostics
| where ResourceType == "VAULTS"
| where ResultType == "Forbidden" or ResultType == "Unauthorized"
| project TimeGenerated, CallerIPAddress, OperationName, ResultType, ResultSignature, id_s
| order by TimeGenerated desc
Building on Queries: Alerts and Workbooks
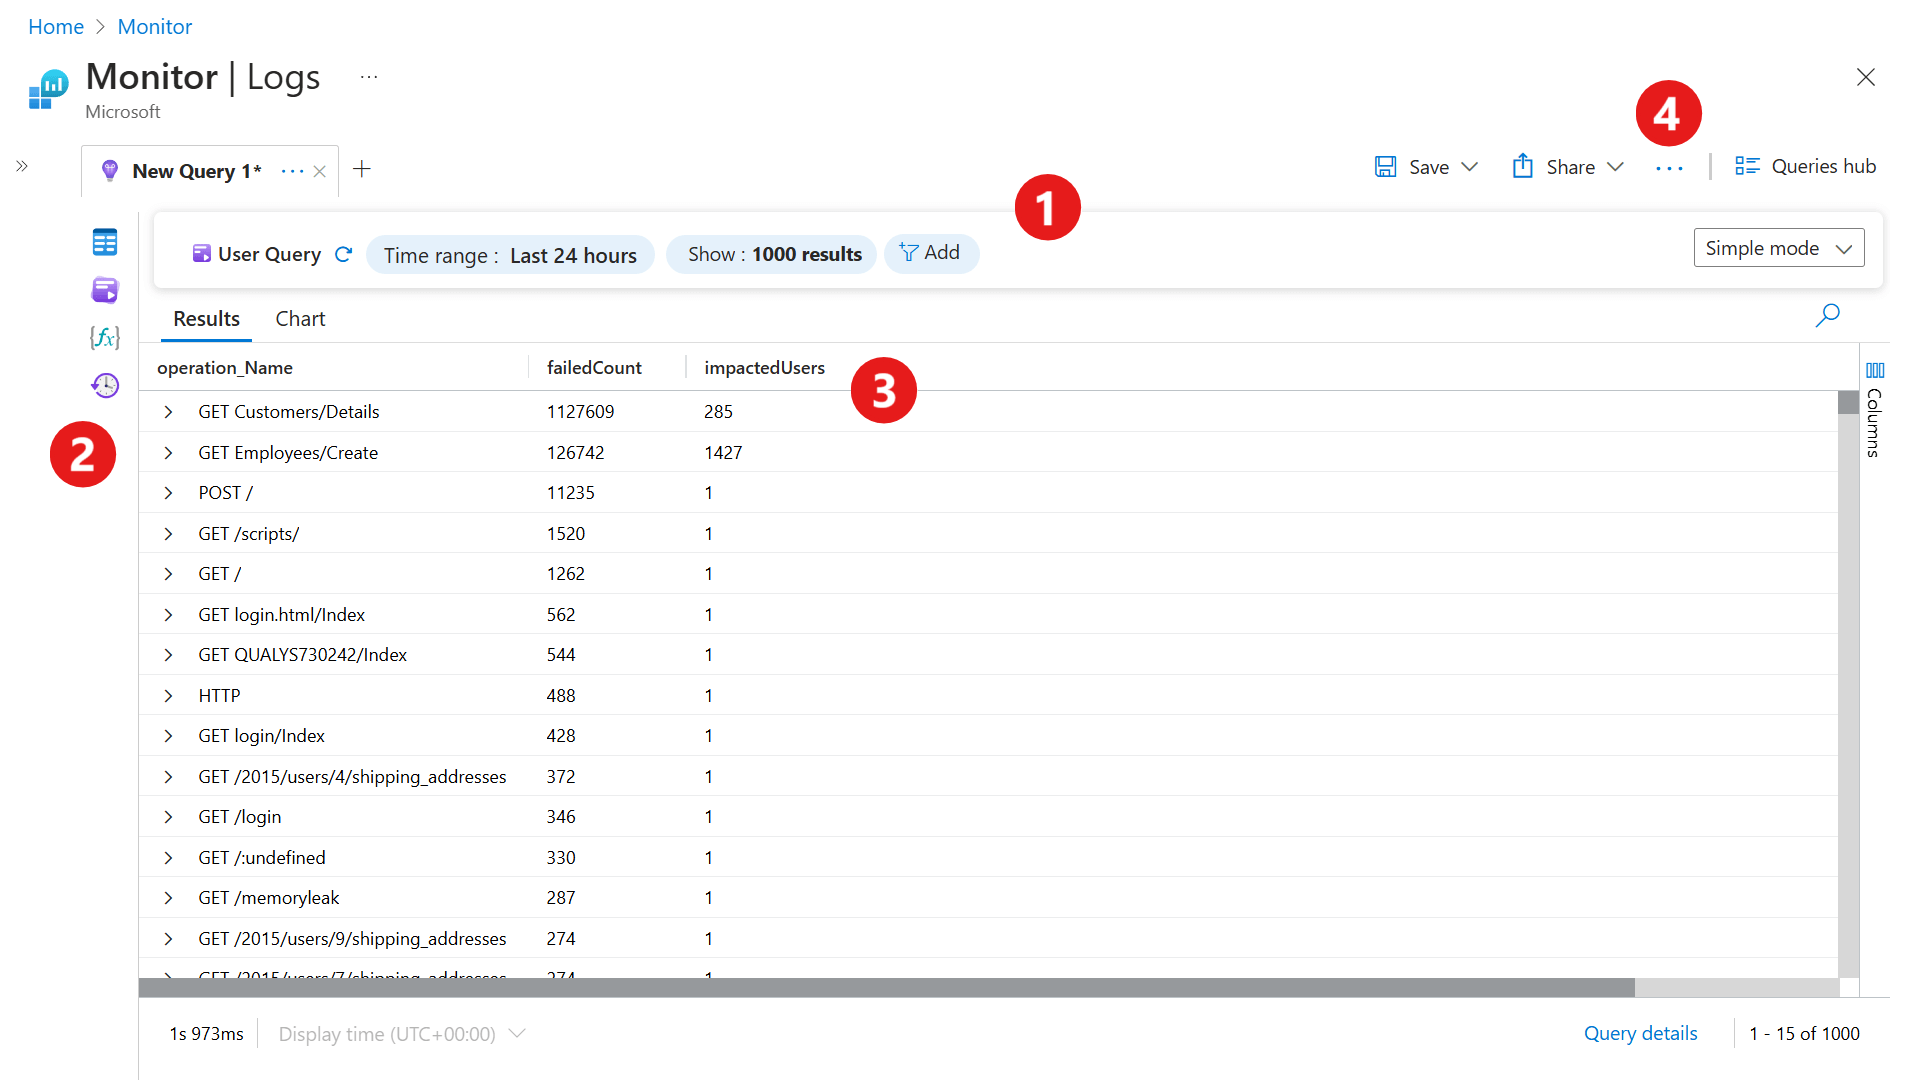
Once you have a query that's useful, you don't have to run it manually every time. From the Log Analytics query editor, you can:
Create an alert rule: Use the "New alert rule" button above the query results. Azure Monitor will run the query on a schedule and trigger an action group if the result meets a threshold you define. This is how you build alerts for things like "more than 100 firewall denies in 5 minutes from the same source IP."
Pin to a workbook: Azure Monitor Workbooks let you combine multiple queries into a single dashboard-like view with time controls and parameterization. Good for building a network health view or a security overview that your team can open and check regularly. Workbooks live under Azure Monitor > Workbooks.
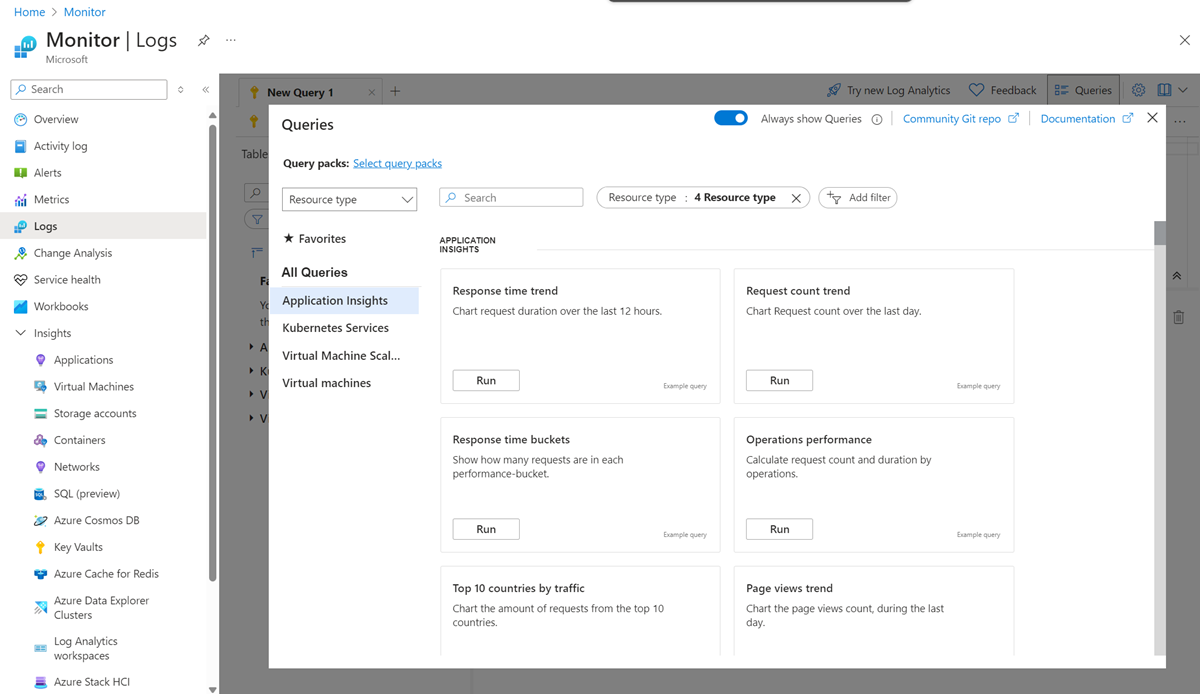
Save queries: In the Log Analytics workspace, you can save queries to a personal or shared library. Shared queries are visible to everyone with access to the workspace. Building a library of your team's commonly used queries is worth doing.
A Note on Data Retention and Cost
Log Analytics charges for data ingestion and for retention beyond the free tier (31 days for most tables, 90 days for certain security tables if you have Defender for Cloud enabled). For high-volume tables like NSG flow logs or verbose App Gateway access logs on busy workloads, ingestion costs can add up.
Some practical ways to manage this: use commitment tiers for predictable ingestion volume, configure table-level retention so less-used tables roll off faster, and be selective about which log categories you actually need. Sending everything to Log Analytics because it's available is a quick way to generate a large monitoring bill without proportional value.
The Azure Monitor Logs pricing page has the current rates, and the Cost Analysis blade in the Azure portal can break down your Log Analytics costs if they become material.
Sources: Log Analytics overview, KQL overview, Azure Monitor data sources, Azure Firewall structured logs, Traffic Analytics