Setting Up a FinOps Hub: Components, Benefits, and Querying the Data
In this article
Setting Up a FinOps Hub: Components, Benefits, and Querying the Data
A plain Cost Management export drops a pile of CSVs in a storage account and leaves the rest to you. A FinOps hub takes those exports and builds a proper analytics platform around them: conformed, deduplicated, FOCUS-aligned cost data you can query in seconds, connect Power BI to, and point AI tools at. This post covers what the hub template actually deploys, why each piece is there, how it beats a raw export, and the three ways I interface with the data once it's running.
The FinOps hub is part of the open-source Microsoft FinOps toolkit. It's a Bicep/ARM template you deploy into your own subscription, your data never leaves your tenant.
What Is a FinOps Hub?
A FinOps hub is a self-hosted data platform that ingests Cost Management exports, transforms them into a clean, query-optimized format, and exposes them through Power BI, Azure Data Explorer, Microsoft Fabric, and any tool that can read those. Think of it as the backend data store you'd otherwise have to build yourself, except the FinOps toolkit team builds and maintains it for you.
The whole thing starts at roughly $120/mo plus about $10/mo per $1M in cost monitored when you include Data Explorer, or about $5 per $1M if you run storage-only without the analytics engine. For most organizations that's a rounding error against the spend it helps you optimize.
The Components It Deploys, and Why
When you deploy the hub template, it lays down a handful of resources that work together as a pipeline. Here's each one and the job it does.
| Resource | What it's for |
|---|---|
| Storage account (Data Lake Storage Gen2) | The staging area and data lake. Holds the raw exports, the processed parquet data, and hub configuration. |
| Data Factory | The engine. Orchestrates ingestion, transformation, deduplication, and cleanup through a set of pipelines and triggers. |
| Azure Data Explorer (Kusto) or Microsoft Fabric RTI | Optional but recommended. The scalable analytics datastore that makes year-over-year queries return in seconds. |
| Key Vault | Stores the Data Factory managed identity credentials (deployed for remote/cross-tenant hub scenarios). |
| Managed identities | How Data Factory authenticates to storage, Key Vault, and Data Explorer, no secrets in code. |
| Managed private endpoints | Private network paths to the storage account and Key Vault when you deploy the hub with private networking. |
Storage account (Data Lake Gen2)
This is the heart of the hub, and it's organized into a few containers, each with a distinct role:
msexports— the raw landing zone. Cost Management writes FOCUS-formatted exports here. You don't touch this container, it's managed by the pipelines.ingestion— the cleaned, conformed data in parquet format, deduplicated and ready to query. This is what reports and tools read when you go storage-only.config— the hub's settings (settings.json), which scopes it monitors, retention, and so on.
The template uses Premium_LRS by default (or Premium_ZRS for high availability). Premium is required because Data Lake Gen2 doesn't offer Standard tiers for this workload.
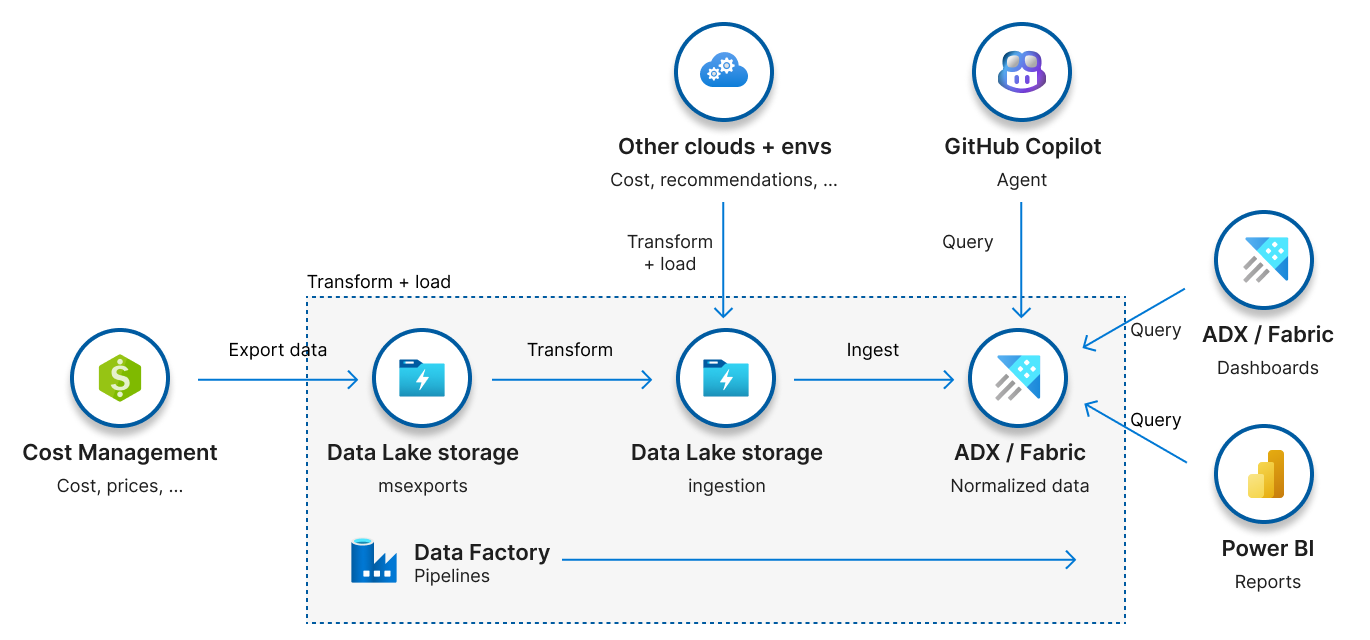
Data Factory
This is where the "hub" earns its name. Data Factory runs a set of pipelines and triggers that turn raw exports into analytics-ready data automatically:
Cost Management export (FOCUS)
        │  writes to
        ▼
   msexports container
        │  Event Grid fires manifest-added trigger
        ▼
   msexports_ETL_ingestion pipeline
        │  converts CSV → parquet, removes duplicated history
        ▼
   ingestion container (clean parquet)
        │  manifest-added trigger
        ▼
   ingestion_ETL_dataExplorer pipeline
        │  ingests parquet into Kusto
        ▼
   Data Explorer / Fabric  →  Power BI, KQL, MCP, the Multitool
It also runs housekeeping pipelines: config_ConfigureExports creates the Cost Management exports for you (with managed exports enabled), config_StartBackfillProcess pulls historical months on first deploy, and daily/monthly schedule triggers keep current and prior-month data fresh.
Azure Data Explorer (or Fabric Real-Time Intelligence)
This is the optional piece that changes everything about performance. Without it, Power BI reads parquet from storage, which works fine for small estates but times out somewhere north of $1M in monitored spend. With Data Explorer (or Fabric RTI), the data lands in a columnar analytics engine and complex queries over years of history come back in seconds.
Microsoft's guidance: add Data Explorer or Fabric once you're monitoring more than $100,000 in spend. The cluster creates two databases:
Ingestion— stores the raw ingested data and hub settings history.Hub— the public-facing layer. It exposes clean, version-stable functions likeCosts()andPrices()that abstract away the internals, so your queries don't break when the underlying schema evolves.
Why a Hub Beats a Plain Cost Export
A Cost Management export is a great primitive, but you hit its ceiling fast. Here's what the hub gives you that a raw export doesn't, straight from the FinOps hubs benefits:
| Plain Cost Management export | FinOps hub | |
|---|---|---|
| Data format | Raw CSV, schema shifts over time | Parquet, deduplicated, FOCUS-aligned, backwards-compatible |
| Multi-tenant / multi-account | One export per scope, no consolidation | Report across accounts and subscriptions in separate tenants |
| Query performance | Whatever you build | Year-over-year queries in seconds via Data Explorer |
| Savings analysis | Manual | Summarizes negotiated and commitment discount savings (EA + MCA) |
| History | Limited, you manage it | Configurable retention, backfilled on deploy |
| AI / agents | None | MCP server that understands FinOps and connects to your data |
| Analytics engines | None | Data Explorer or Fabric Real-Time Intelligence out of the box |
| Maintenance | You build and run the data platform | Maintained by the FinOps toolkit team |
The two that matter most in practice: FOCUS alignment means your cost data follows the FinOps Open Cost and Usage Specification, an open, vendor-neutral schema, so reports and skills you build keep working across dataset versions. And deduplication into parquet means you're not re-processing overlapping daily exports every time you query; the hub does that work once, on ingest.
The honest trade-off: a hub is more moving parts than a single export, and it's a data platform you operate. But you're not building it, and the pieces are designed to update cleanly as new toolkit releases ship.
Deploying It
The full walkthrough is in the official deploy tutorial. The short version:
-
Register the resource providers. The hub uses
Microsoft.CostManagementExportsto publish data andMicrosoft.EventGridto know when new data lands. Register both on your subscription first (or letInitialize-FinOpsHubDeploymentfrom the toolkit PowerShell module do it). -
Plan your networking with your network team, public storage firewall or private endpoints. The template defaults to a private virtual network and supports a
/26(or larger) address range for private endpoints, deployment scripts, and Data Explorer subnets. -
Deploy the template. Use the portal button (Deploy to Azure, with Gov and 21Vianet variants available) or deploy the Bicep directly. Key parameters:
hubName— names all the resources and tags them with a commoncm-resource-parentfor cost roll-ups.location— match your Fabric capacity region if you're connecting to Fabric.dataExplorerName— set this to deploy a Kusto cluster (leave empty for storage-only; provide a Fabric eventhouse query URI to use Fabric instead).storageSku—Premium_LRS(cheapest) orPremium_ZRS(zone-redundant).scopesToMonitor— the subscriptions or billing scopes to ingest.
-
Wire up the exports. With managed exports enabled, the hub creates the Cost Management exports for you; otherwise create them manually pointing at the
msexportscontainer. -
Connect a report or dashboard. Set up the Data Explorer dashboard or the toolkit's Power BI reports.
Permissions to be aware of: deploying the template needs Contributor + Role Based Access Control Administrator (or Owner); configuring exports needs Cost Management Contributor at subscription/RG scope, or the equivalent billing-scope role for EA/MCA/MPA.
Interfacing with the Data
Once the hub is running, the data is yours to query however you like. Here are the three ways I actually use it.
1. Microsoft Fabric
If your organization is on Fabric, this is the cleanest path. You can deploy the hub directly against a Fabric Real-Time Intelligence eventhouse instead of a standalone Data Explorer cluster, pass your eventhouse query URI as the dataExplorerName and leave the Kusto cluster empty. The cost data lands in a KQL database in your Fabric workspace, where you get Real-Time dashboards, OneLake integration, and the rest of the Fabric analytics stack over the same FOCUS data.
The toolkit also ships Power BI reports in three flavors: a demo set with sample data, a KQL set that connects to Data Explorer/Fabric, and a storage set that reads parquet directly. They're starter templates, meant to be customized.

2. Azure Data Explorer (KQL)
When I want to answer a specific question fast, I go straight to KQL against the Hub database. Because the hub exposes version-stable functions, the queries stay simple and don't break across dataset versions:
// Top 10 services by cost over the last 90 days
Costs
| where ChargePeriodStart >= ago(90d)
| summarize TotalCost = sum(EffectiveCost) by ServiceName
| top 10 by TotalCost desc
// Month-over-month cost trend by subscription
Costs
| summarize Cost = sum(EffectiveCost)
    by SubscriptionName, Month = startofmonth(ChargePeriodStart)
| order by Month asc
EffectiveCost, ChargePeriodStart, and ServiceName are all FOCUS columns, so these queries are portable to any FOCUS-aligned dataset. If you want to go deeper on writing KQL, I have a dedicated post on Log Analytics and KQL that covers the query language in detail.
3. The FinOps Multitool
This is where it comes full circle for me. The Azure FinOps Multitool I built reads cost data from a FinOps hub or Cost Management export by default, and only falls back to the live Cost Management APIs when no hub is in scope. Pointing it at a tenant that has a hub means faster, cheaper scans with real history, because it's reading the conformed parquet data model instead of hammering the throttled Query API.
The Multitool's MCP server is the agentic version of the same idea, and it lines up with the hub's own AI story. The FinOps hub benefits explicitly call out an MCP server that "understands FinOps and seamlessly connects to your data", so you can ask GitHub Copilot or a custom agent plain-language questions and have it reason over your actual cost data. Between the hub's data model and an MCP layer on top, "where am I wasting money this month" becomes a question you can just ask.
Conclusion
A FinOps hub is the difference between having cost data and being able to use it. The template hands you a maintained data platform, storage for staging, Data Factory for the ETL, and Data Explorer or Fabric for fast analytics, all aligned to the open FOCUS schema. From there, the data is yours to query in Fabric, KQL, Power BI, or the FinOps Multitool, whichever fits how you work.
If you're already living in Cost Management exports and feeling the ceiling, the hub is the natural next step. Start with the FinOps hubs overview and the deploy tutorial.